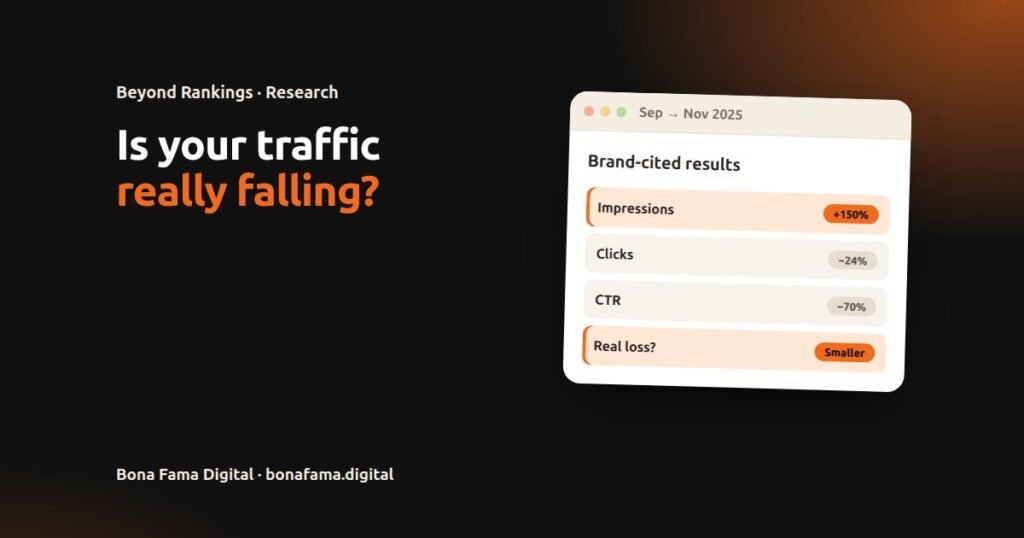
A falling click-through rate (CTR) doesn’t always mean you’re losing clicks. In one published table, impressions for cited results rose 150% in two months while clicks fell 24%, so CTR dropped by 70%. Most of that “collapse” came from the site being shown more often, not from people clicking less. Growing impressions, a few dominant accounts, labels applied after the fact and day-to-day AI citation churn can all make a dashboard show a decline that isn’t really there.
This is the third finding of Beyond Rankings, our review of 36 studies on search and AI visibility. Before you rewrite pages or change agencies, check which of these four traps you’re looking at.
Trap 1: The Denominator Grew
CTR is clicks divided by impressions. If impressions grow faster than clicks, CTR falls even when clicks hold up.
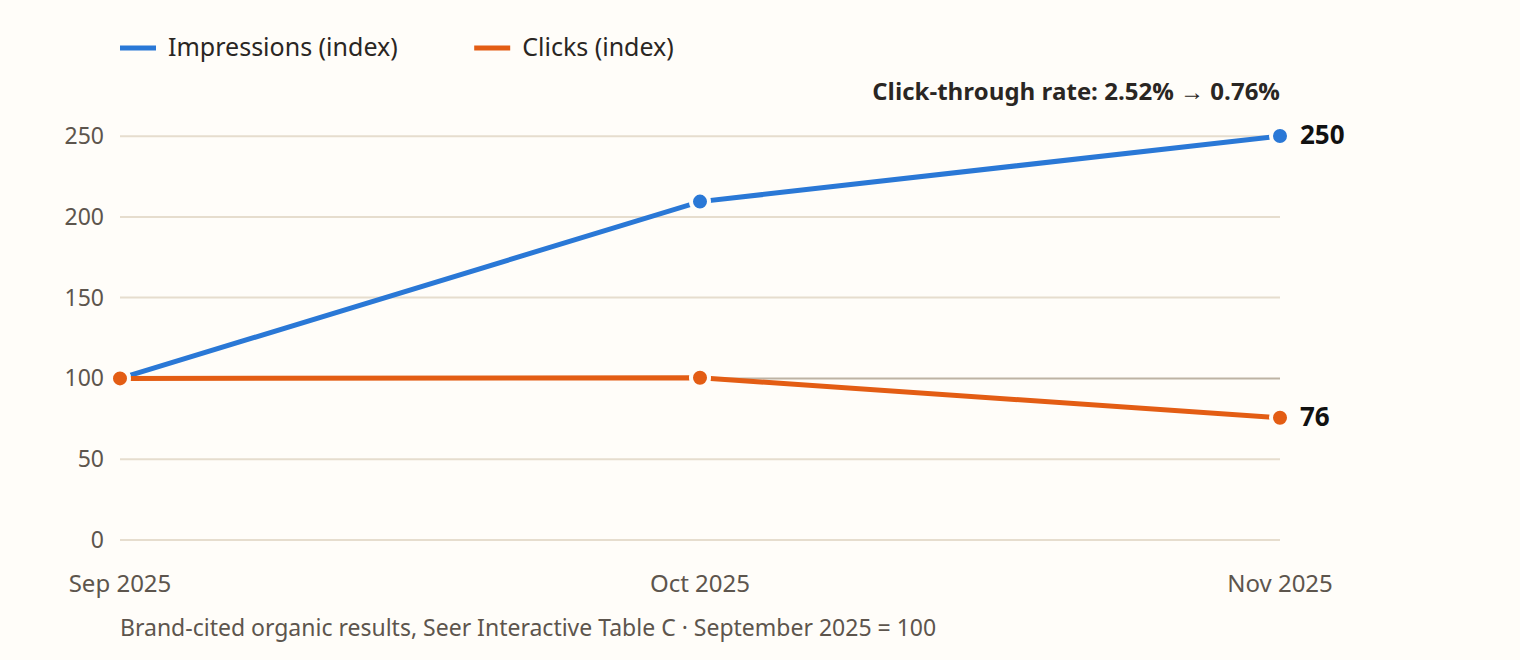
In Seer Interactive’s data for brand-cited results:
| Measure | September 2025 | November 2025 | Change |
|---|---|---|---|
| Impressions | 15.8 million | 39.5 million | +150% |
| Clicks | 398,798 | 301,783 | −24% |
| Click-through rate | 2.52% | 0.76% | −70% |
The loss of clicks is real, but it’s about a third of what the CTR change suggests. When your site starts appearing on many more searches, often below an AI Overview, CTR falls almost automatically.
How to check: look at clicks, not just CTR, and split your queries by whether they show an AI Overview.
Trap 2: One Account Dominates the Average
Aggregate CTR is weighted by impressions, so one large site can move the whole number. In Seer’s informational queries where the brand wasn’t cited, one account produced 47% of all impressions at a CTR of just 0.20%. With that account included, the segment’s CTR was 0.94%. Without it, the CTR would have been about 1.61%.
The same thing happens in your own reports when one page, or one product line, dominates impressions.
How to check: look at medians and at a fixed set of queries you’ve tracked for months, not only at the site-wide average.
Trap 3: The Label Came Later
Some studies label each query by whether it showed an AI Overview in the most recent snapshot, then apply that label to every earlier month. A query that gained an AI Overview in October is treated as an “AI Overview query” in January as well. That can make those queries look as if they behaved differently before AI Overviews even existed.
How to check: ask your agency or tool vendor whether AI Overview labels are recorded at the time or applied later. In your own analysis, label each query by the month it first showed an AI Overview.
Trap 4: AI Citations Simply Come and Go
AI answers change from day to day even when nothing on your website changes. Ahrefs tracked about 37,500 citations across five AI tools for 20 days. Half or more of the websites cited on day one were gone by day two, and about three-quarters of the dropped citations came back within the 20 days.
How to check: count how many of the last seven days you were cited, and wait two to three weeks before treating a lost citation as real.
A Quick Diagnostic Checklist
| What you see | Possible explanation | How to check |
|---|---|---|
| CTR falls sharply, clicks fall a little | You’re shown on more searches, often below an AI Overview | Compare clicks, not CTR; split by query and AI Overview presence |
| A category-wide CTR drops while your pages look stable | A few large sites or new queries changed the mix | Use medians and a fixed set of queries |
| “AI Overview queries” looked different before AI Overviews existed | Labels were applied retrospectively | Label queries by the month they first showed an AI Overview |
| An AI citation vanishes overnight | Normal volatility | Count days cited out of the last 7; wait 2–3 weeks |
| Clicks fall on AI Overview queries, with stable impressions and positions | A real click loss | Plan for it |
Even well-known studies contain slips. One reports a 2024 zero-click rate that doesn’t match its own earlier study, and another describes cited CTR as “2–5x” uncited CTR while its own table shows about 1.2 to 3.9 times. None of these changes the direction of the findings, but each would change a forecast built on them.
Measure What Changed After You Publish
The cleanest way around these traps is to measure a fixed set of pages and questions over time. FamaCue connects to Search Console with read-only access, shows the questions behind your impressions, and lets you mark a page as published, then tracks what changed in its impressions, clicks and position, so you’re comparing like with like rather than a site-wide average. Try it free for 7 days.
Track before-and-after results with FamaCue
Frequently Asked Questions
Why is my CTR dropping but clicks are stable?
Usually because impressions grew. Your pages are being shown on more searches, often lower on the page or below an AI Overview, so CTR falls even though clicks hold.
Should I report CTR or clicks?
Both, every month. If CTR falls and clicks don’t, you’re probably being shown more, not losing.
How long should I wait before acting on a lost AI citation?
Two to three weeks. About three-quarters of dropped citations returned within 20 days in Ahrefs’ tracking.
How do I know if a traffic drop is real?
If clicks fall on queries that show AI Overviews while impressions and positions stay stable, the loss is real and worth planning for.
Sources
- Kimachia, K. (2026). Beyond Rankings. Bona Fama Digital. Finding 3.
- McDonald, T., Cooley, H., & Williams, M. (2026). AIO impact on Google CTR: 2026 update. Seer Interactive.
- Makosiewicz, M., & Guan, X. (2026). How stable are AI citations? Ahrefs.
- Fishkin, R. (2026). In 2026, less than one third of Google searches still send a click. SparkToro.