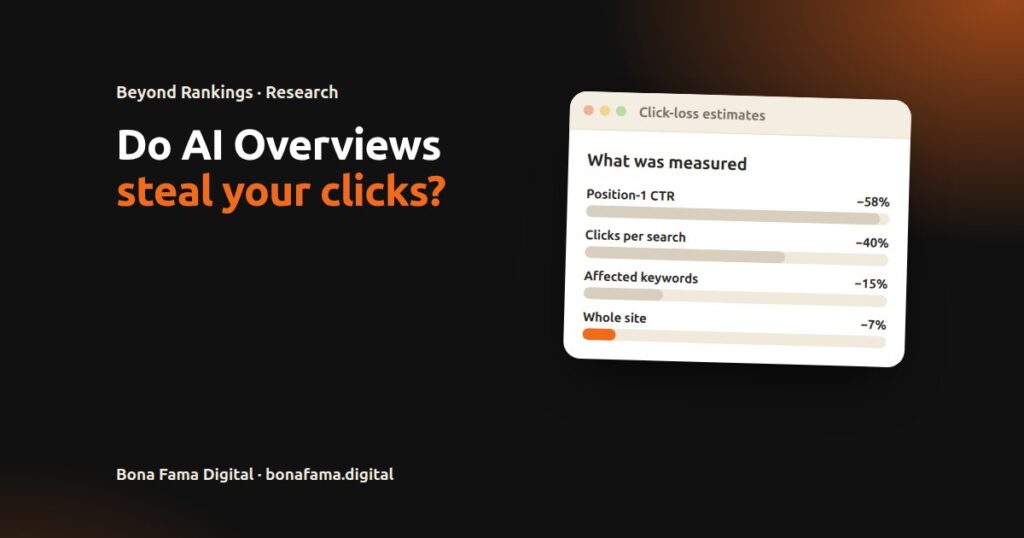
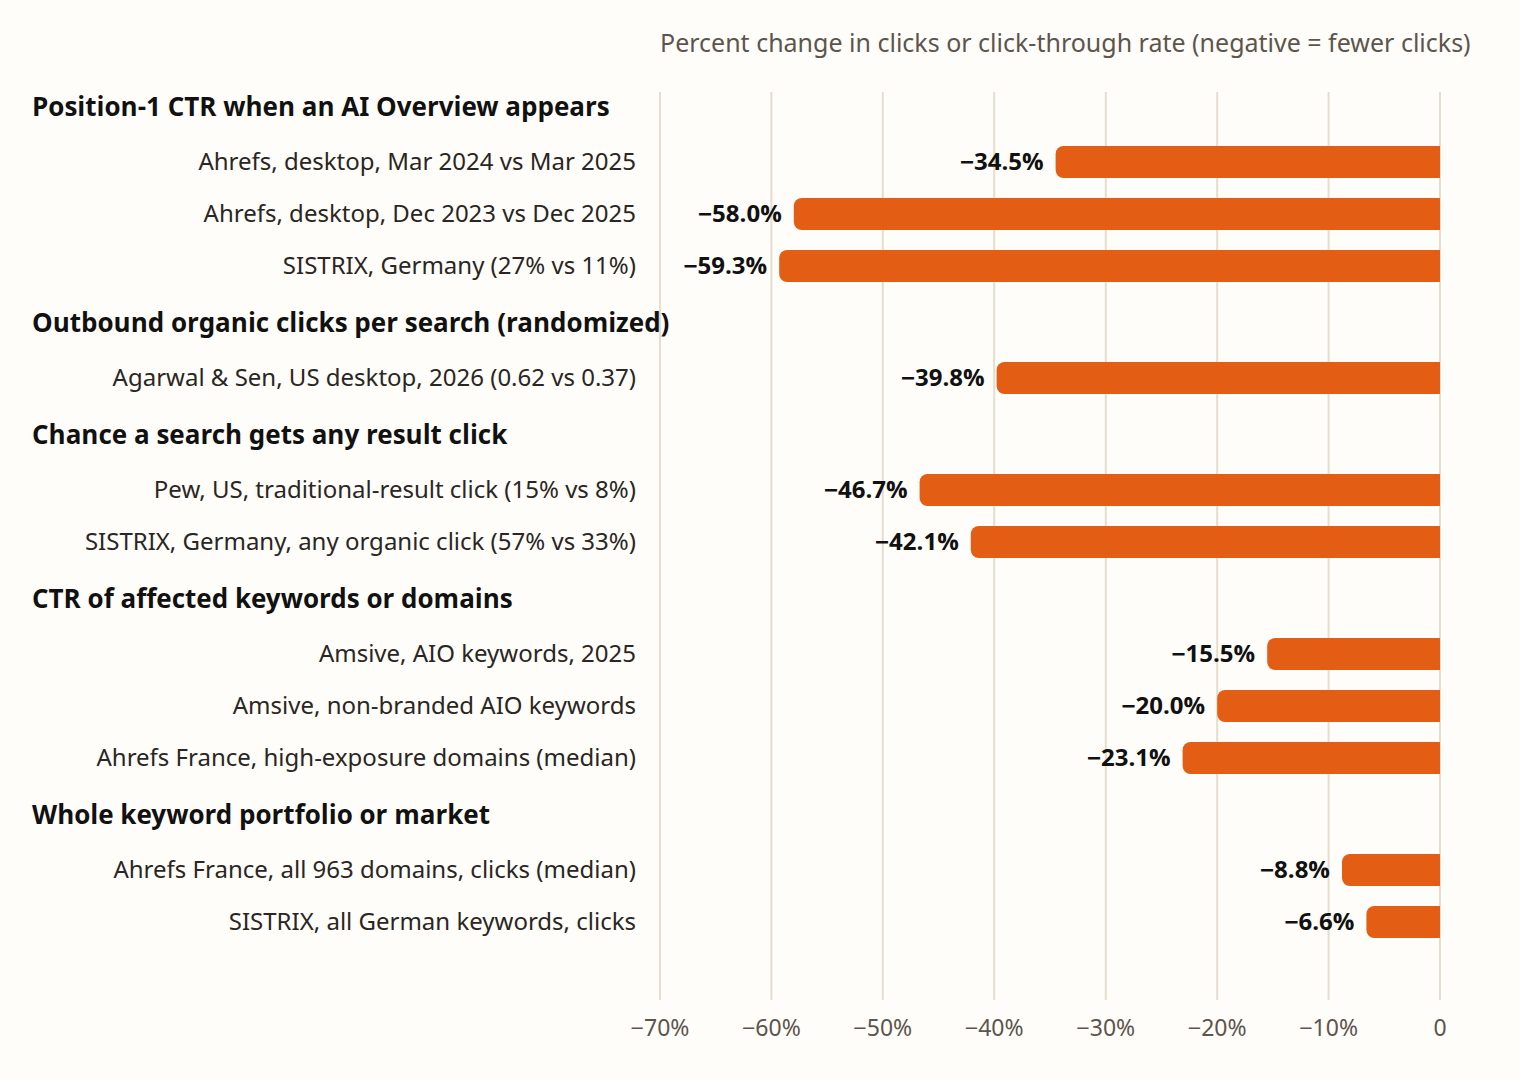
Yes, AI Overviews reduce clicks on the searches where they appear. Every credible study agrees on that. The reason the published numbers look so different (58%, 39.8%, 23.1%, 15.5%, 6.6%) is that each one measures a different thing. On the informational queries that trigger an AI Overview, the top result can lose around half its click-through rate. Across a whole website, the loss is usually in the single digits.
That’s the first finding of Beyond Rankings, our review of 36 studies published between January 2025 and November 2026. Here’s how to read the headlines, and which number to use when you plan.
Why Do AI Overview Click-Loss Studies Disagree?
Because “click loss” means at least five different things. When the estimates are grouped by what they measure, they stop contradicting each other.
| What was measured | Typical estimate | Example study |
|---|---|---|
| Position-one click-through rate on queries with an AI Overview | About 58% to almost 60% lower | Ahrefs (300,000 keywords); SISTRIX (100M+ German keywords) |
| Outbound organic clicks per affected search | 39.8% lower | Randomized experiment with US desktop Chrome users |
| Chance that a search produces any click | Roughly halved (8% vs 15% of visits in Pew’s US panel) | Pew Research Center; SISTRIX |
| Click-through rate for affected keywords or domains | 15.5% to 23.1% lower | Amsive (700,000 keywords); Ahrefs France |
| Clicks across a whole keyword portfolio | 8.8% fewer clicks (France, median domain); 6.6% (Germany) | Ahrefs France; SISTRIX |
The position-one figure is the largest because it looks only at the most exposed slot on the most exposed queries. The portfolio figure is the smallest because most searches don’t show an AI Overview at all.
Is There Real Evidence, or Just Vendor Data?
There is real evidence. The strongest is a randomized field experiment, the only one in this field so far. Researchers used a browser extension to hide AI Overviews for a random group of US desktop Chrome users. On searches where an AI Overview appeared, or would have appeared, outbound organic clicks fell from 0.62 to 0.37 per search, and the share of searches with no click at all rose from 54% to 73%.
Two independent programs, Ahrefs and SISTRIX, also land on almost the same position-one estimate, one of them in Germany. When different data owners using different methods agree, you can rely on the direction.
Did Clicks Recover in 2026?
Not clearly. In early 2026, Ahrefs reported that position-one losses had grown to 58%, while Seer Interactive reported a recovery. Lined up by month, most of that disagreement disappears. Both programs show December 2025 as the low point. Seer’s recovery comes from January and February 2026, which Ahrefs didn’t measure. Two months of recovery from one program is not yet a trend.
Other Reasons the Numbers Differ
The outcome being measured explains most of the spread, but four design choices also matter:
- When AI Overview exposure was recorded. Some studies label a keyword by its latest status and apply that label to earlier months.
- Which keywords were chosen. Picking keywords because they show an AI Overview today can select queries whose intent also changed.
- How the comparison was made. Randomized assignment removes most confounding; simple before-and-after comparisons absorb seasonality and algorithm updates.
- Panel and device mix. Clickstream panels differ in who is in them and how mobile is weighted.
Which Number Should You Use for Your Own Forecast?
Use two numbers, not one:
- On your informational queries that trigger an AI Overview, assume clicks to the top result could fall by around half.
- Across your whole site, expect a much smaller effect, likely single digits, unless most of your traffic comes from simple question-and-answer content.
Then replace both with your own data. Compare the queries that show an AI Overview with similar queries that don’t, and track clicks, not just click-through rate. Applying a 58% headline to your total traffic will badly overstate your risk.
Find Out Which of Your Questions Trigger AI Overviews
The questions that matter here are the ones your customers already ask. FamaCue reads your Google Search Console data, collects the full, natural questions that bring people to your site, and checks Google’s AI Overview for them, showing which sites it cites. You’ll see which of your questions are exposed, and which pages already answer them. Every plan starts with a 7-day free trial, no card needed.
Frequently Asked Questions
Do AI Overviews reduce website traffic?
Yes, on the searches where they appear. A randomized experiment found outbound organic clicks fell 39.8% on affected searches. Across a whole site the loss is usually much smaller, because most searches don’t show an AI Overview.
Why does one study say 58% and another 6.6%?
They measure different things. 58% is the drop in position-one click-through rate on queries with an AI Overview. 6.6% is the estimated share of all organic clicks lost across Germany.
Have clicks recovered since AI Overviews launched?
The evidence is unclear. One program reported a recovery in January and February 2026, but it hasn’t been replicated and covers only two months.
How do I measure the effect on my own site?
In Search Console, compare clicks on queries that show an AI Overview with similar queries that don’t, and track clicks as well as click-through rate.
Sources
- Kimachia, K. (2026). Beyond Rankings. Bona Fama Digital. Finding 1.
- Law, R., & Guan, X. (2026a). Update: AI overviews reduce clicks by 58%. Ahrefs.
- Beus, J. (2026). AI overviews in Germany: How much click-through rates are really dropping. SISTRIX.
- Rijo, L. (2026). AI Overviews cut publisher clicks 39.8% in first randomized study. PPC Land (reporting Agarwal & Sen, 2026).
- Chapekis, A., & Lieb, A. (2025). Google users are less likely to click on links when an AI summary appears. Pew Research Center.
- Guevara, W. (2025). Google AI overviews: New CTR study. Amsive.
- Begue, J., & Guan, X. (2026). AI overviews cut CTR by 23.1% in France. Ahrefs.
- McDonald, T., Cooley, H., & Williams, M. (2026). AIO impact on Google CTR: 2026 update. Seer Interactive.